PingTrace Guide
PingTrace pings a host and traces the route to it at the same time. It shows whether the host answers and how fast, every router between your PC and the host, how many probes each router loses, who operates it, and — in continuous (MTR) mode — how the route behaves over time. This guide describes all commands, result columns and settings of PingTrace 3.0.
Contents: Getting started · Main window · Ping list · Traceroute list · Continuous traceroute (MTR) · Reading the results · Whois / IP Info · TCP Port Check · Settings · Export and print · Menus, tray and shortcuts · Trial and registration
Getting Started
- Type a host name (example.com), a URL (https://www.example.com/page), an IPv4 address (8.8.8.8) or an IPv6 address (2001:4860:4860::8888) in the Enter Host Name, URL or IPv4 / IPv6 Address box. From a URL PingTrace uses only the host name.
- Press Enter or click Start to ping the host and trace the route to it at the same time. Click Ping or Trace to run only one of them.
- Click IPv4 or IPv6 to ping and trace over that address family only. Start, Ping and Trace use the address family chosen in Settings (Automatic by default).
- Replies and hops are added to the lists as they arrive. Press Esc or click Stop to stop both; Action > Stop Ping and Stop Traceroute stop one of them.
Main Window
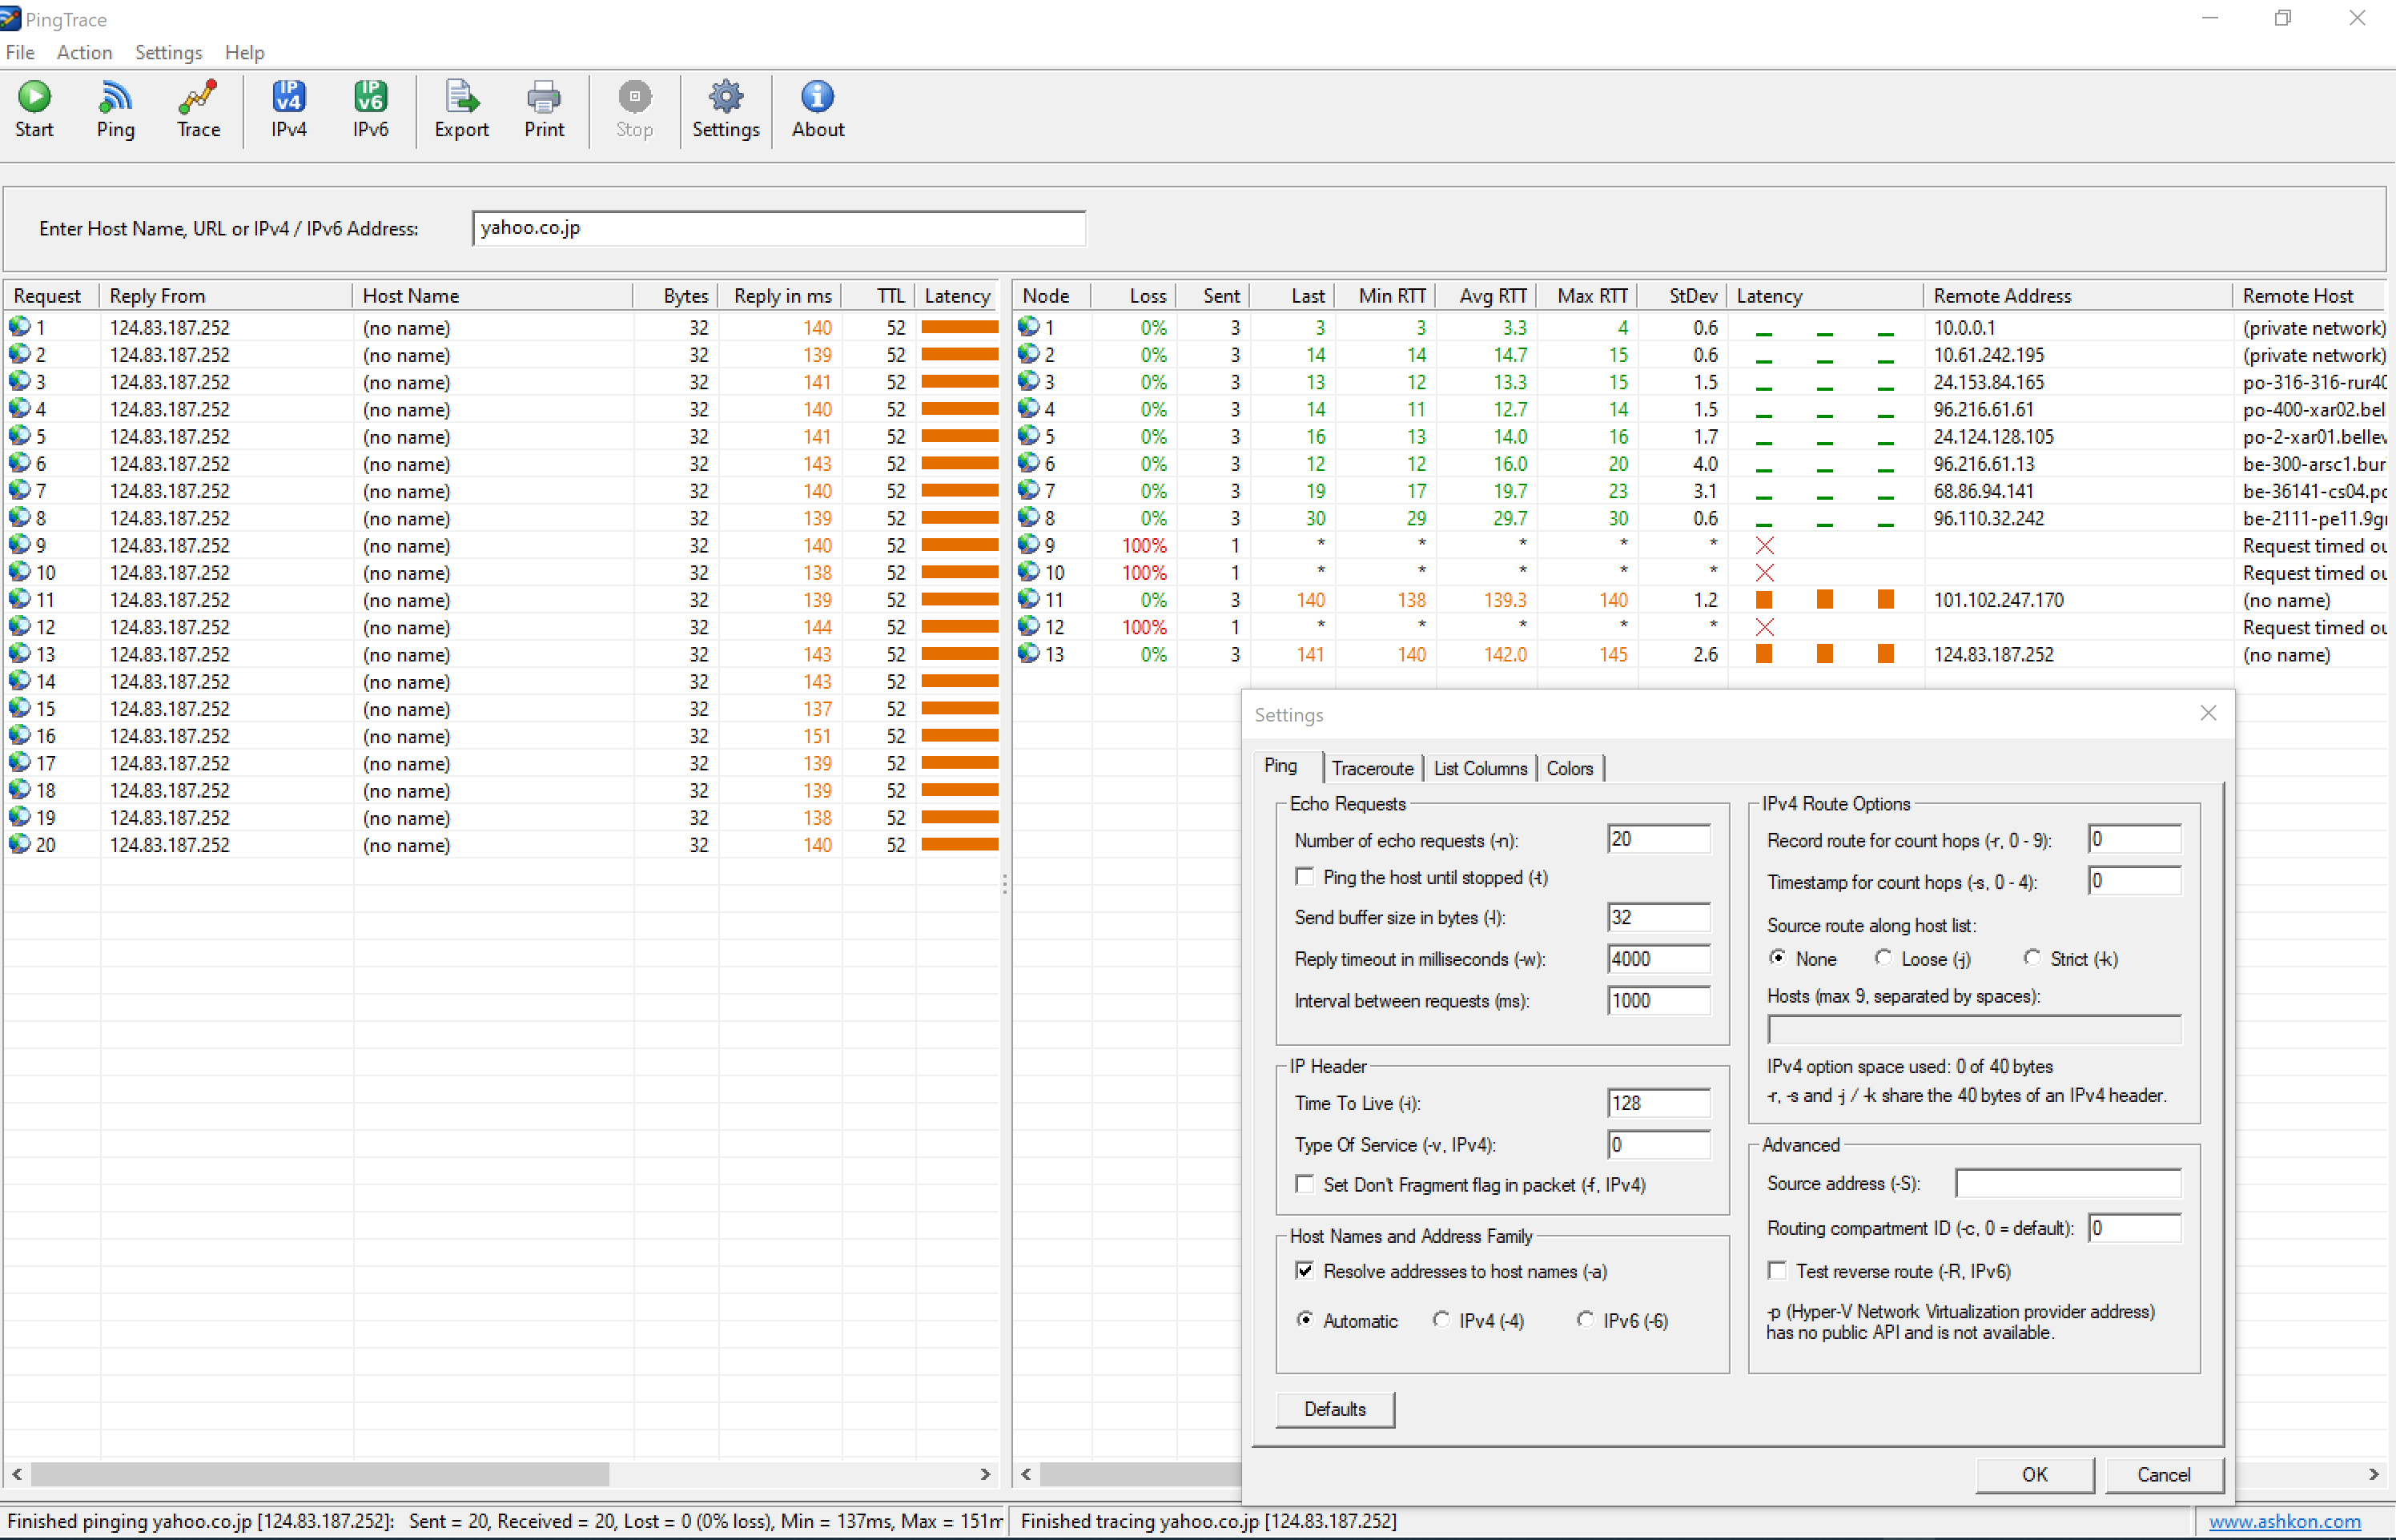
The window has the toolbar, the address box, the ping list on the left and the traceroute list on the right. Drag the bar between the two lists to change their widths; PingTrace remembers the position, the window size and the column widths. The status bar has three parts: the result of the last ping (sent, received, lost, minimum / maximum / average time), the result of the last trace, and a link to the Ashkon Software web site.
Toolbar
| Start | Ping the host and trace the route to it at the same time (Enter). |
| Ping | Ping the host only. |
| Trace | Trace the route to the host only. |
| IPv4 | Ping and trace over IPv4 only (-4). |
| IPv6 | Ping and trace over IPv6 only (-6). |
| Export | Save the ping list, the traceroute list or both lists to a file. |
| Print the ping list or the traceroute list. | |
| Stop | Stop ping and traceroute (Esc). |
| Settings | Open the Settings dialog. |
| About | Show the program version and registration information. |
Ping List
Each row is one echo request sent to the host. By default 20 requests are sent, one per second.
| Column | Description |
|---|---|
| Request | Sequence number of the echo request. |
| Reply From | Address that sent the reply. Usually the host itself; a router address here means an error reply, for example "TTL expired in transit". |
| Host Name | Reverse DNS name of the replying address (when Resolve addresses to host names (-a) is on). |
| Bytes | Size of the data in the reply. |
| Reply in ms | Round-trip time of the request in milliseconds, colored by the latency thresholds. |
| TTL | Time To Live of the reply packet (IPv4). It hints at how many routers the reply passed: replies usually start at 64, 128 or 255. |
| Latency | A bar whose length shows the reply time, colored by the latency thresholds. |
| Status | Result of the request when there is no normal reply, for example Request timed out or Destination host unreachable. |
| Route / Timestamps | Addresses and timestamps recorded in the packet when the IPv4 options Record route (-r), Timestamp (-s) or source routing (-j / -k) are used. |
Traceroute List
Each row is one hop (router) on the path; the last row is the destination host. By default each hop is probed 3 times.
| Column | Description |
|---|---|
| Node | Hop number, starting from 1 (usually your own router). |
| Loss | Percentage of probes to this hop that got no reply, colored by the loss thresholds. |
| Sent | Number of probes sent to this hop. In continuous (MTR) mode it grows with every cycle. |
| Last | Round-trip time of the latest reply, in milliseconds. |
| Min / Avg / Max RTT | Fastest, average and slowest round-trip time of all replies, in milliseconds. |
| StDev | Standard deviation of the round-trip times (jitter). A high value means the delay of the hop varies a lot. |
| Latency | A sparkline of the most recent probes; a taller bar means a slower reply. A red cross marks a probe that got no reply. |
| Remote Address | IPv4 or IPv6 address of the hop. |
| Address Type | Public, Private (RFC 1918), CGNAT (RFC 6598), Private (ULA), Public (Teredo / 6to4) or another special range. |
| Remote Host | Reverse DNS name of the hop. Router names often include a city or airport code that tells where the router is. |
| ASN | Autonomous System number of the network that the address belongs to, for example AS7922. |
| AS Name | Name of the organization that operates that network. |
| Network | The BGP prefix announced for the address, for example 24.153.64.0/19. |
| Country | Country in which the AS is registered (not necessarily where the router is). |
| Registry | Regional Internet Registry of the address: ARIN, RIPE NCC, APNIC, LACNIC or AFRINIC. |
Private and CGNAT hops have no public ownership data, so their ASN columns stay empty. Click a column header to sort a list by that column; numbers are sorted by value.
Continuous Traceroute (MTR)
A single trace sends only a few probes to each hop, so short bursts of packet loss or delay are easy to miss. In continuous mode PingTrace traces the route again and again and merges the results into running statistics for every hop, like the mtr tool on Linux and macOS.
- Turn it on with Action > Continuous Traceroute (MTR), or permanently on the Traceroute page of Settings (Trace continuously and keep running per-hop statistics).
- Cycles sets how many times the route is traced; 0 traces until you click Stop. Interval between cycles sets the pause between two traces (1000 ms by default).
- Sent and Loss count all probes of all cycles; Last is the newest reply, Min, Avg, Max and StDev are calculated over all replies, and the Latency sparkline shows the last 64 probes.
- Let it run for a few minutes while the problem happens (a video call that stutters, a game that lags), then look for the first hop where loss or jitter starts and continues to the destination.
Reading the Results
- "Request timed out" with * in the RTT columns and 100% loss means the router did not reply in time. Many routers ignore or rate-limit traceroute probes but forward normal traffic, so a silent hop in the middle of the route is usually not a problem.
- A real problem shows as loss or a jump in delay that continues on every following hop up to the destination. The first hop where it starts is where to look.
- Loss on one middle hop only, with 0% loss at the destination, is the router limiting its own replies — not lost traffic.
- The ping list is the final answer for the destination: if pings get through with steady times, the host is reachable whatever the middle hops show.
- A large increase in RTT between two hops in different cities or countries is normal: it is the distance the signal travels. Compare the AS Name and Remote Host columns to see where your provider hands traffic to another network.
- If the host does not answer ping at all, it or its firewall may block ICMP. Use the TCP Port Check to see whether its services are still up.
Colors
With the default thresholds latency is green up to 50 ms, yellow up to 100 ms, orange up to 200 ms, red up to 400 ms and dark red above. Packet loss is green below 1%, yellow from 1%, orange from 5% and red from 20%. The thresholds can be changed on the Colors page of Settings.
Whois / IP Info
Right-click a row in either list and choose Whois / IP Info... to see who owns the address. The IP Info window shows:
- the IP address, its reverse DNS name and its AS number and organization;
- the registration data (RDAP) of the address: network name and handle, address range and CIDR, country, organization, abuse e-mail and other contacts, registration and last-changed dates.
Copy copies the report to the clipboard, and View RDAP Record opens the original record in your web browser. Opening this window sends the address to rdap.org and to the registry that holds it, and to Team Cymru for the AS lookup. The same right-click menu has Copy IP Address.
TCP Port Check
Many servers and firewalls block ping, so a host that does not answer ping may still be up. Choose Action > TCP Port Check..., or right-click a row and choose TCP Port Check... to check that address.
- Host: host name or IP address to check. Ports: a list of ports and ranges, for example 22, 80, 443, 3389, 8000-8010; up to 1024 ports.
- Timeout (ms) and Attempts per port: how long to wait for each connection and how many times to try each port.
- Click Check. Each port gets a TCP connection and one of these results: Open — a service accepts connections; Closed (refused) — nothing listens on the port, but the host is up; No answer (filtered) — no reply at all, usually a firewall; Unreachable — the network reported the host as unreachable.
- The list also shows the connect time, minimum / maximum time, the number of answers, and the IANA service name and description of each port.
- Service names come from the IANA port registry, downloaded from iana.org and refreshed every 30 days (Update from IANA downloads it now). Until it is downloaded a built-in list of common ports is used.
- Copy copies the results to the clipboard as tab-separated text.
Settings
Click Settings on the toolbar or use the Settings menu to open a page directly. The equivalent Windows ping or tracert option is shown in parentheses next to each setting. Defaults restores the original settings of the page. All settings are saved and kept when you upgrade from an earlier version of PingTrace.
Ping page
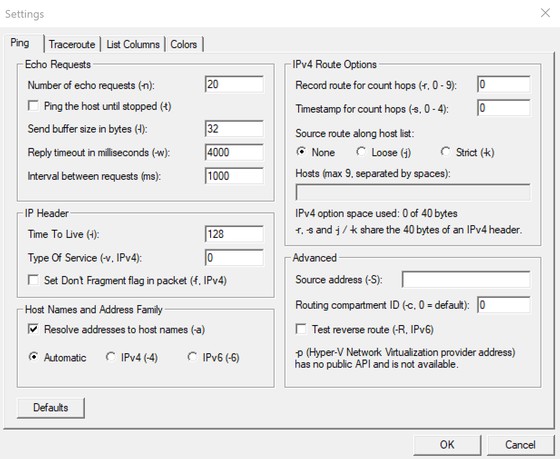
- Number of echo requests (-n, default 20), or Ping the host until stopped (-t).
- Send buffer size in bytes (-l, default 32): size of the data in each request. Larger sizes together with Don't Fragment help find the path MTU.
- Reply timeout in milliseconds (-w, default 4000) and Interval between requests (default 1000 ms).
- Time To Live (-i, default 128), Type Of Service (-v, IPv4) and Set Don't Fragment flag (-f, IPv4).
- Resolve addresses to host names (-a) and the address family: Automatic, IPv4 (-4) or IPv6 (-6).
- IPv4 Route Options: Record route for up to 9 hops (-r), Timestamp for up to 4 hops (-s), and Loose (-j) or Strict (-k) source routing along a list of up to 9 hosts. These options share the 40 bytes of option space in the IPv4 header; the dialog shows how much is used. Results appear in the Route / Timestamps column.
- Advanced: Source address (-S), Routing compartment ID (-c) and Test reverse route (-R, IPv6). The -p option (Hyper-V Network Virtualization provider address) has no public Windows API and is not available.
Traceroute page
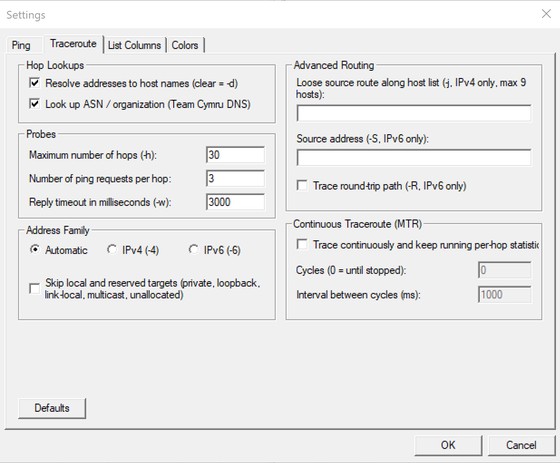
- Resolve addresses to host names: fills the Remote Host column. Clear it (same as tracert -d) for a faster trace.
- Look up ASN / organization: fills ASN, AS Name, Network, Country and Registry through the Team Cymru DNS service.
- Maximum number of hops (-h, default 30): if it is too small, the trace stops before it reaches a distant host.
- Number of ping requests per hop (default 3): more probes give more accurate values but make each trace slower.
- Reply timeout in milliseconds (-w, default 3000): a timeout that is too short makes slow routers look as if they do not respond.
- Address Family: Automatic, IPv4 (-4) or IPv6 (-6). Skip local and reserved targets refuses to trace private, loopback, link-local, multicast and unallocated addresses.
- Advanced Routing: Loose source route along up to 9 hosts (-j, IPv4 only), Source address (-S, IPv6 only) and Trace round-trip path (-R, IPv6 only).
- Continuous Traceroute (MTR): see above.
List Columns page
Select which of the 9 ping list columns and 17 traceroute list columns to show. Hiding unused columns makes the lists easier to read on smaller screens. Hidden columns are not exported or printed.
Colors page
Turn coloring on or off and set the latency limits (in milliseconds) for green, yellow, orange and red, and the packet-loss limits (in percent) for yellow, orange and red. The colors apply to Last, Min, Avg and Max RTT, Loss and the Latency sparkline in the traceroute list, and to Reply in ms and the latency bar in the ping list.
Export and Print
- Click Export on the toolbar, use the File menu or right-click a list and choose Export This List.... You can export the ping list, the traceroute list or both lists into one file.
- Choose CSV (comma-separated, opens in Excel) or tab-separated text. The file name suggested is PingTrace-<list>-<host>-<date>.csv. When both lists are exported, each part starts with the host and the date and time of the test, followed by the ping statistics — ready to attach to a support ticket for your Internet or hosting provider.
- Click Print or use File > Print Ping List / Print Traceroute List to print a list.
- Clear List in the right-click menu empties a list.
Menus, Tray and Shortcuts
| Menu | Commands |
|---|---|
| File | Export Ping List, Export Traceroute List, Export Both Lists, Print Ping List, Print Traceroute List, Exit. |
| Action | Start Ping and Traceroute, Start using IPv4 / IPv6, Ping Only, Traceroute Only, Continuous Traceroute (MTR), Stop All, Stop Ping, Stop Traceroute, TCP Port Check, Open Host in Web Browser, Flush DNS Cache. |
| Settings | Opens the Ping, Traceroute, List Columns or Colors page of the Settings dialog. |
| Help | Register Now (order page), Contents (online help), Ashkon Software Web Site, About PingTrace. |
| Right-click a list | Whois / IP Info, Copy IP Address, TCP Port Check, Export This List, Print This List, Clear List. |
| Tray icon | Ping and Trace, Ping, Trace, Show, Exit. |
- Flush DNS Cache clears the Windows DNS resolver cache, so a host name that has just moved to a new address is looked up again.
- When you minimize PingTrace it moves to the notification area (system tray). Right-click the tray icon to start a ping or trace, or choose Show to bring the window back.
- Keyboard: Enter or F5 starts ping and traceroute, Esc stops them.
Trial and Registration
PingTrace is shareware. You can use it free for 30 days; after that please buy a license for $19.95. Help > Register Now! opens the order page. A license is for one person or one workstation.
System Requirements
Windows 7, 8, 8.1, 10 or 11 (32-bit and 64-bit), with IPv4 or IPv6 network connectivity. IPv6 tests require an IPv6 connection to the Internet. Whois / IP Info, ASN lookups and IANA service names need Internet access.